

Infrastructure · Performance
Application Testing with Apache JMeter
By the LogiNet Team — Jun 29, 2025
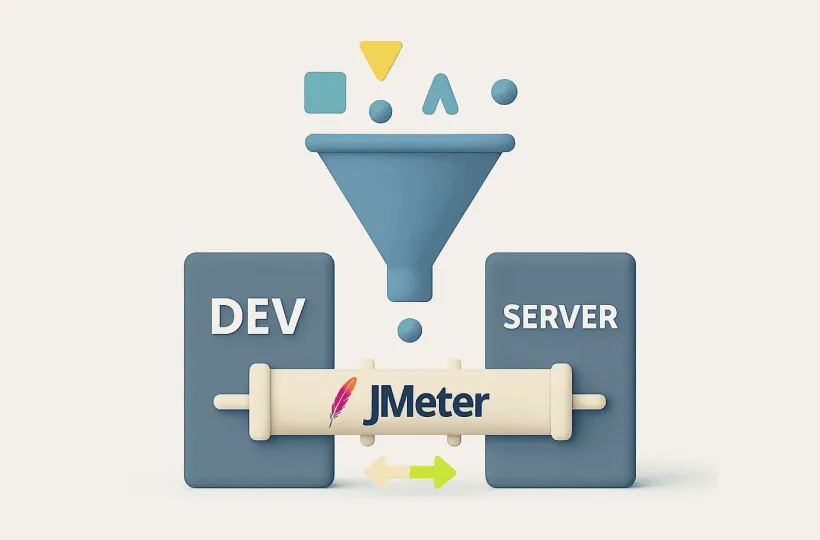
Performance testing early in development helps avoid costly downtime later. Apache JMeter is the free, open-source load and performance testing tool built by the Apache Foundation. It's Java-based and works across web services, databases and server-side systems to measure response times and load capacity.
What Makes JMeter Useful
- Wide protocol support — HTTP, HTTPS, JDBC, FTP, JMS, LDAP, SOAP and more, covering most kinds of systems.
- User traffic simulation — models many simultaneous users to see how a server handles load.
- Functional testing — beyond raw performance, it can automate testing of HTTP requests, database queries and other request types.
- A GUI and a CLI — tests can be built and results analyzed visually, or run headless from the command line.
- Extensibility — a modular plugin structure lets the tool be adapted to specific needs.
A Step-by-Step Approach to Performance Testing
Defining the test environment starts with understanding the client's users: demographics, access patterns, connection speeds, client applications and hardware. Next comes defining exit criteria — concrete benchmarks like supporting 1,000 concurrent users or keeping response times under 40 milliseconds. Test planning documents the full scenario: user volumes, use cases, and how test data will be generated. Finally, the test environment itself should mirror production as closely as possible, with the right monitoring tools in place.
A test starts with a Thread Group that sets user count, ramp-up time, iterations and duration, with requests (typically HTTP requests) added underneath it and listeners attached to view the results. From there, JMeter's building blocks come into play: controllers (If, Loop, While, Switch, Transaction, Random and more) for test logic, assertions to verify responses automatically, timers to simulate realistic delays between requests, and pre/post-processors to prepare data and extract values from responses using tools like Regular Expression Extractor, JSON Extractor or XPath Extractor.
Running and Analyzing Tests
Tests can run in GUI mode for building and iterating, from the command line for CI/CD automation, or distributed across multiple machines to simulate heavier load. The two numbers that matter most afterwards are throughput (how much the system processed in a given time) and error rate (the share of requests that failed). JMeter can generate an HTML report combining a results summary, the test methodology, throughput and error-rate breakdowns, and server-side monitoring graphs for CPU, memory and disk from tools like Grafana.
LogiNet has used JMeter in production engagements — analyzing how a threefold traffic increase would affect a client's infrastructure, and extending inherited load tests to cover more of an application's components.